


A number of people have asked me to cover bitcoin after this week’s insanity - and I will very soon, I promise, but today we consider fossil fuels once again.
While the oil and natural gas prices have not done a great deal these last six months - up a bit, down a bit, then sideways - the associated companies have done very well: the producers, the service companies and so on.
Many years of bear market and belt-tightening are now paying off.
However, we are not yet, I would suggest, at that point of excess and decadence that marks the end of a cycle - crazy mergers and acquisitions, insane valuations and Bacchanalian behaviour from the executive classes. So I venture today, as last week, that there is still plenty of gas left in the tank of this bull market.
With that in mind I wanted to share a few charts with you today that give an idea of what is possible.

Oil and gas stocks are on the rise
The first of them shows the ratio between energy stocks and the rest of the market. Indeed, without energy stocks there would not be a rest of the market. A simple point that many, especially those who make policy, seem oblivious to. The world we live in today and the economic benefits we enjoy, relative to our ancestors, have been made possible by fossil fuel.
So here is the energy sector relative to the the S&P 500. The higher the chart goes, the bigger the relative market cap of energy stocks.
You can see that, even with the rally we have seen in energy companies since 2020, on a relative basis, energy companies are, give or take, where they were at the turn of the century, when oil itself was around $10/barrel and that secular bull market was only just getting started.
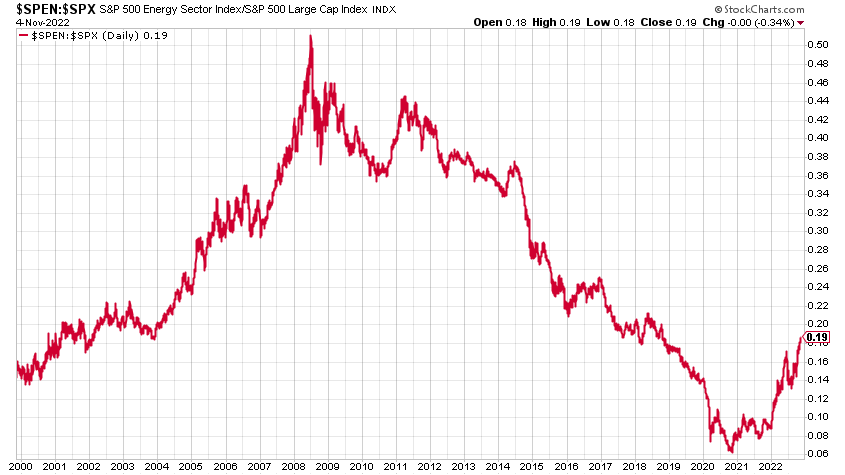
You can also see that we are in an uptrend. Energy stocks are increasing in value, while the broader S&P500 is flat or falling.
It’s also worth noting that the relative market cap was almost three times as large in mid 2008, when oil went to $147/barrel.
The inference is that the bull market has a lot further to run.
Oil versus stocks
Next we consider the ratio between oil - West Texas Intermediate - and the S&P 500.
You would expect this chart to trend lower over time because oil production and extraction techniques should improve over time, while broader economies and the companies who operate in them grow.
Nevertheless we are below the levels we were in the early part of the century. You can see how high this ratio went in 2008 - and how low in Corona panic of 2020, when oil futures, somehow, went into negative territory.
It feels a bit like, as far as this ratio is concerned, we are in late 2003.
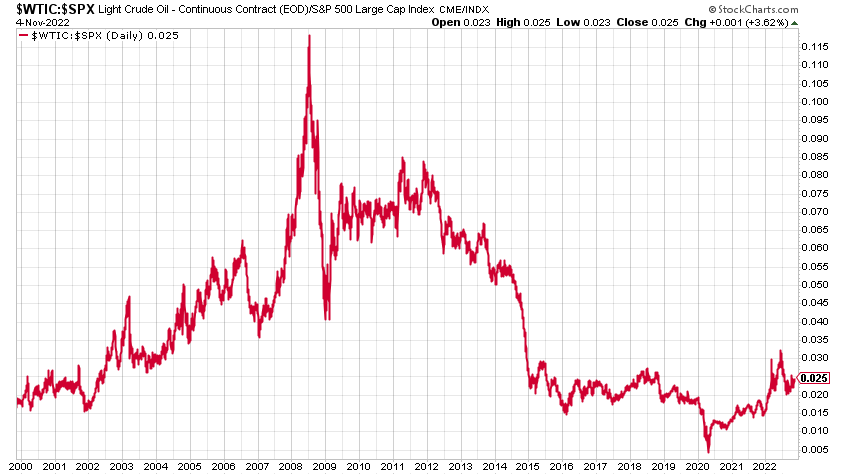
Relative to the S&P 500, oil is roughly where it was three or five years ago - I’d say it’s at its 3- or 5-year average. And it’s a lot cheaper than it was throughout that entire 2003 to mid-2014 timeframe.
So even with the gains of the last two years, oil does not look expensive relative to the S&P 500. It is at the cheaper end of the range. Another sign there is more gas left in the bull market tank.
Here now we look at oil relative to gold. These two - as hard commodities - tend to trade in a much tighter range over time, but my observation again is that it is in the low to middle of the 20-year range and not at one of those points of extremity whereby you might consider rolling out of one and into the other.
For sure we are nothing like where we were went oil went to $147 in 2008. In fact, we are below where we were for most of the 2000s. On the basis of this chart, oil is probably the cheaper of the two.

Trade of the lustrum
As regular readers will vouch, oil is a drum I have been beating since 2016 when it was $25 or so, declaring it our “trade of the lustrum”. A lustrum is a five-year period - a useful and underused word I’d say.
That lustrum is now becoming a decade. We continue to beat the drum on oil, gas, coal and the related companies. Fossil fuel demand will continue to grow until at least 2030, the IEA has forecast (2040 in the case of natural gas). That means it is not just enough to maintain current production levels, they need to increase. Yet there have been seven or eight years of underinvestment - leading to today’s shortages. Partly because of ESG deterring investment, partly because so much capital has gone into green energy related companies instead and partly because of the excesses of the previous bull market still needed to be purged. The bull market conditions are still good and longer term, I think fossil fuel stocks go higher.
I’m a big believer in narratives within markets. The fossil fuel story is only slowly starting to change. Many are realising just how important they are and what they have made possible. Indeed, that there is a strong moral case for them, not against them.
But the narrative is not yet at end-of-cycle levels. When people start talking about Peak Oil again - that’s the sort of thing you want to be looking out for. That the need for alternative energy sources is not because fossil fuels are bad, but because we have consumed them all
I don’t know what the end-of-bull market narratives will be - that’s a story that is yet to be told. But if legislators and subsidisers start abandoning electric vehicle initiatives because the ultimate source of the electricity remains the burning of fossil fuels, and it’s really quite inefficient, never mind hypocritical - that is one possible scenario
So hold on to your positions - enjoy the ride.
This article first appeared in Moneyweek.


Hold on to your oil, gas and coal stocks